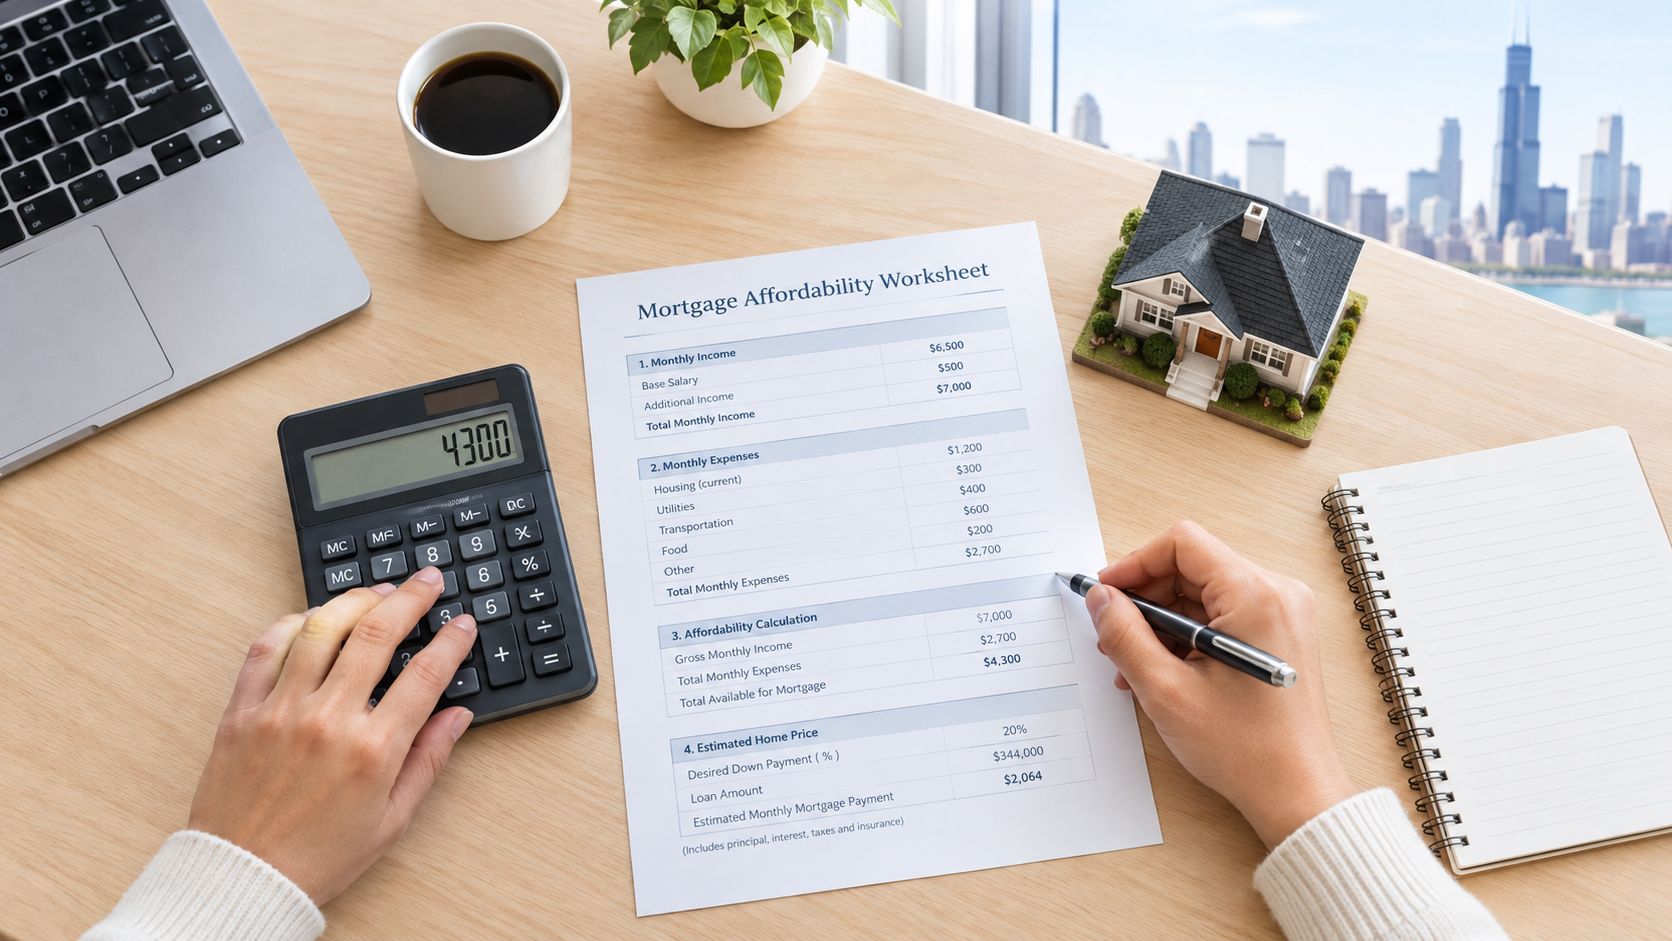
You're sitting at the kitchen table with a preapproval letter in one hand and a monthly budget in the other, and the numbers don't line up the way you expected. The lender says you qualify. Your checking account says something different. That gap is where most buyers in the western suburbs get uncomfortable, especially after the first tax bill, insurance quote, or HOA notice shows up.
The right way to figure out how to calculate mortgage affordability is to stop using one number and start using two. One number is what a lender can approve on paper. The other is what your life can actually carry after taxes, insurance, dues, commuting, childcare, repairs, and the rest of real life get paid.
Table of Contents
- Why Most Buyers Calculate Affordability Wrong
- The Two Ratios Lenders Actually Use
- Building the Full Monthly Payment Line by Line
- The Life-Track Affordability Worksheet
- Three Down Payment Scenarios Compared
- Running the Numbers in a Mortgage Calculator
- Putting It Together and Knowing When to Walk Away
Why Most Buyers Calculate Affordability Wrong
A couple in Melrose Park can do everything right and still end up squeezed. They get preapproved near the top of their debt limit, buy a house they can technically carry, then the first escrow amount lands and the monthly payment feels heavier than the estimate suggested. That shortcut fails because the escrow bill arrives after the offer is already accepted.
Buyers who size their purchase off the preapproval letter alone routinely discover the gap at the first escrow reconciliation. The lender approved a loan. The household still has to live with the payment.
Start with two different questions
Ask two questions before you shop. First, what will a lender allow? Second, what can your household comfortably absorb every month without creating stress later? If you only answer the first question, you can wind up house rich and cash poor.
Western Chicagoland makes this mistake expensive. Property taxes in places like Melrose Park, Elmhurst, and other western suburbs can push the monthly payment up fast, and insurance plus association dues add more weight. A payment that looks fine on paper can feel tight once the full housing cost is real.
Practical rule: If a payment only works in a perfect month, it is too high.
Before you open a calculator, have four numbers ready: your gross monthly income, your recurring monthly debts, your best estimate for taxes and insurance, and your realistic down payment. With those in front of you, the math gets clearer and the decision gets less emotional.
The Two Ratios Lenders Actually Use
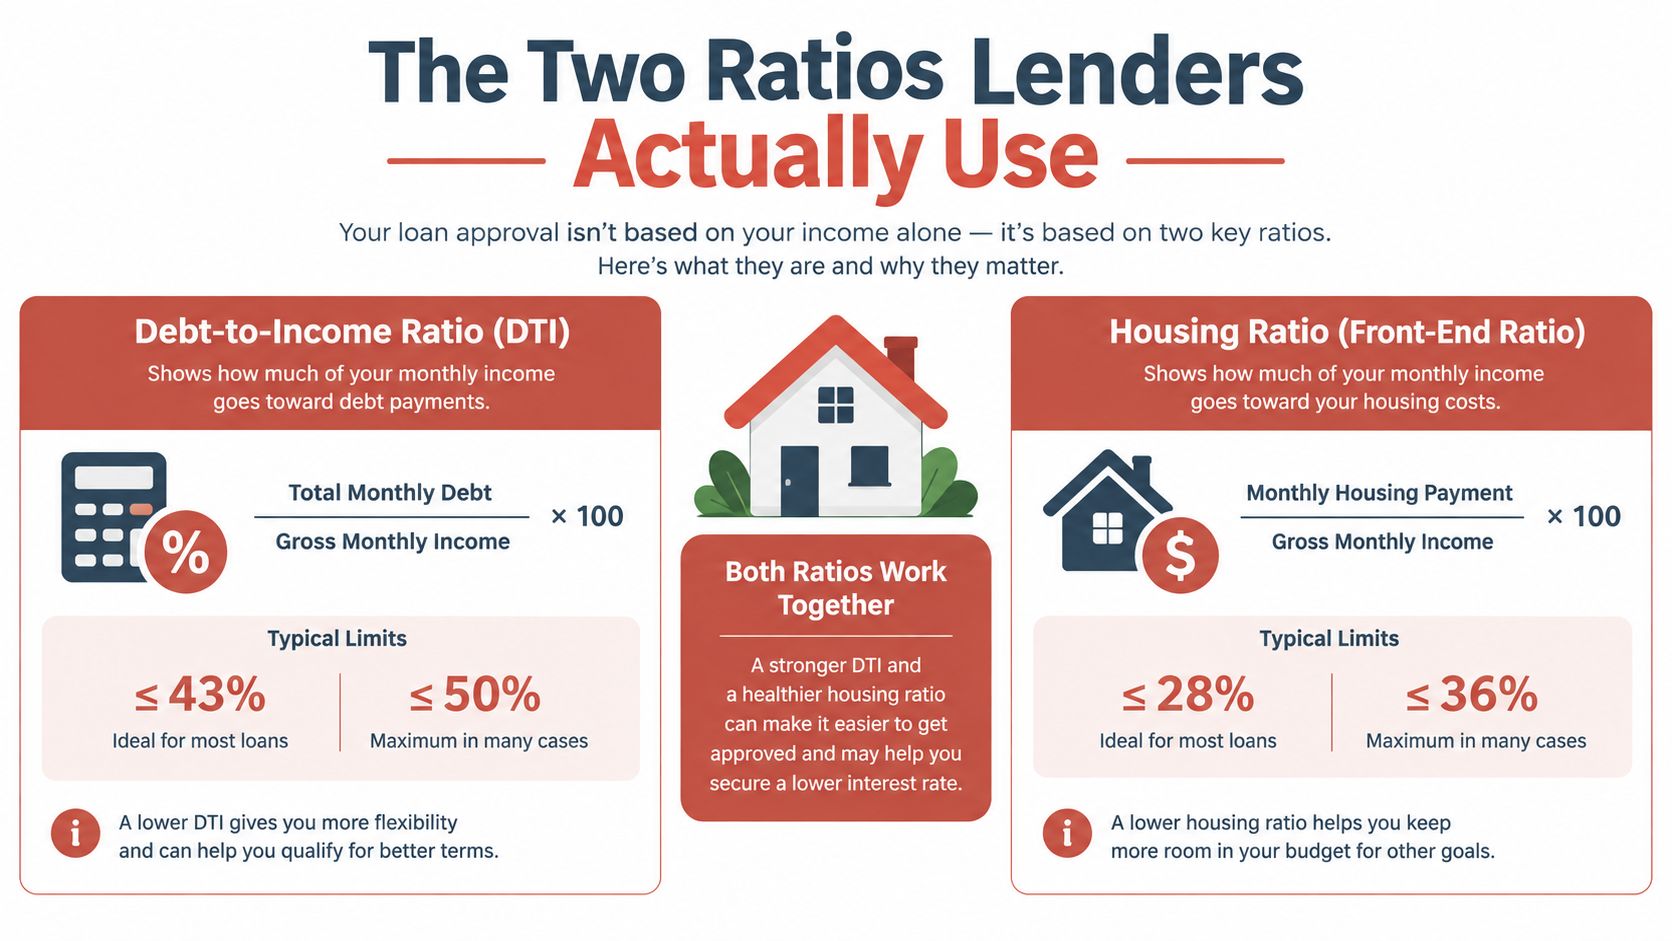
Lenders usually look at affordability through two lenses. The first is the housing-expense ratio, sometimes called the front-end ratio. The second is debt-to-income, or DTI, which is the back-end ratio and includes all recurring monthly debt.
What the 28% and 43% rules really mean
A common planning benchmark for housing is about 28% of gross monthly income for principal, interest, taxes, homeowners insurance, and applicable mortgage insurance or association fees. A broader benchmark for total debt is 43% of gross monthly income under the CFPB's Ability-to-Repay framework for Qualified Mortgages, finalized in 2013 and implemented through federal mortgage rules beginning in 2014 (CFPB mortgage rules fact vs fiction). That 43% figure is a benchmark, not a promise of approval or a recommendation that you spend that much.
Use the $8,000 example to see it clearly. If gross income is $8,000 per month, then 43% allows $3,440 in total monthly debt. If the household already pays $600 for student loans, $400 for auto debt, and $200 for credit cards, existing debt totals $1,200. That leaves $2,240 for the mortgage payment and related obligations. That's the ceiling, not the goal.
Here's the part buyers miss. The calculation must use the full long-term payment, not a temporary teaser rate. If you estimate too low, you're not really calculating affordability, you're flattering yourself.
Front-end and back-end at a glance
| Ratio | What It Includes | Common Benchmark | What It Misses |
|---|---|---|---|
| Front-end ratio | Housing payment only, including principal, interest, taxes, insurance, and applicable fees | About 28% of gross monthly income | Auto loans, student loans, credit cards, and other debts |
| Back-end ratio | Housing payment plus all recurring monthly debts | About 43% of gross monthly income under the CFPB QM benchmark | Cash-flow strain, repairs, savings needs, childcare, and lifestyle costs |
If you want a lender-style answer, this is the cleanest way to get it. If you want the honest answer, keep going.
Building the Full Monthly Payment Line by Line
A monthly mortgage payment is never just principal and interest. In the western suburbs, especially around Melrose Park, Elmhurst, and Naperville, two homes with the same purchase price can produce very different monthly bills because taxes, insurance, and HOA dues rarely line up from one property to the next.
Add every line item, not just the loan payment
Start with the loan itself, then add property taxes, homeowners insurance, mortgage insurance if the down payment is too small to remove it, and association dues if the property has them. If you are comparing homes in different towns, do not assume the tax line will be close. That assumption is a fast way to wreck a budget after closing.
The lender underwrites the loan, but your bank account pays the full housing bill every month. The gap between those two views gets wider when taxes and insurance rise faster than expected. Analysts at Experian's 2026 housing cost analysis found that taxes and insurance represented 21% of homeowners' monthly mortgage payments across 450 large U.S. metros, and escrow costs reached at least 30% of a typical payment in 35 states. That is why principal and interest alone is a poor screen.
Use property-specific numbers, not suburb averages
If you are looking in Melrose Park and Naperville, compare the actual tax bill, insurance quote, and HOA charges for each home. Do not trust a generic suburb-wide affordability percentage. A lower purchase price can still produce a higher monthly payment if the tax bill is heavier or the insurance quote is ugly.
For buyers who want a broader tax question answered, tax treatment depends on individual circumstances and itemizing rules on Schedule A. Do not assume the whole payment works the same way for tax purposes.
A good local worksheet should also include:
- Tax bill: Pull the actual property tax amount for the specific home.
- Insurance quote: Get a real homeowners insurance number for that address.
- HOA or association dues: Check the exact monthly assessment, not a guess.
- Escrow effects: Account for how taxes and insurance will be collected inside the payment.
A broad estimate is fine for a first pass. It is not fine for a final decision. For a quick benchmark on what monthly payments often look like in our area, you can also compare your numbers against a typical monthly mortgage payment.
The Life-Track Affordability Worksheet
The smartest buyers stop asking only what the lender allows and start asking what their household can live with. That's a different calculation. It starts with net income, not gross income, and it respects the fact that life keeps charging after closing day.
The Federal Reserve reported that after accounting for house prices, mortgage rates, property taxes, and homeowners insurance, U.S. homeownership costs relative to median income in 2023 were at their highest level since 1980. That's the warning sign. A maxed-out mortgage might work on paper and still leave a family cash-strapped in practice.
Build your minimum monthly surplus first
Start with your after-tax monthly income. Subtract the bills that do not disappear just because you bought a house. Think childcare, commuting, retirement savings, utilities, maintenance reserves, and a cushion for irregular costs. Then decide the minimum surplus you want left over at the end of a normal month.
That surplus matters more than the lender's approval number. A household can qualify for a larger loan and still feel trapped if the payment eats all the breathing room. This is especially true for relocating families and move-up buyers who face moving costs, temporary overlap, repairs, or renovations right after closing.
A practical way to do it is this:
- Start with net income. Use take-home pay, not gross salary.
- Subtract fixed life costs. Childcare, transportation, savings, and recurring bills.
- Stress the housing payment. Raise taxes, insurance, and utilities in your estimate.
- Protect your surplus. If the remaining number is thin, the home is too expensive.
Buy the house that lets you keep saving when the water heater dies.
A buyer who qualifies at a higher number can still be happier at a lower price if it preserves cash flow. That's not being conservative for the sake of it. That's being realistic.
For local buyers who want a broader buying checklist, Chicago homebuyer tips can help frame the rest of the process around the actual cost of living in the suburbs, not just the approval letter.
Three Down Payment Scenarios Compared
Down payment choices change three things at once. They change the monthly payment, the cash you need to close, and whether mortgage insurance stays on the statement. For a $400,000 western-suburb purchase, the tradeoffs are easy to see when you lay them side by side.
Compare cash, payment, and PMI before you choose
A lower down payment gets you in the door faster, but it usually means mortgage insurance and less equity on day one. A larger down payment reduces the payment and removes PMI at the 20% mark, but it also ties up more cash that could sit in reserves. If you care about flexibility, the decision gets real at that point.
| Scenario | Down Payment | Cash at Closing | PMI | Approx Monthly Cost |
|---|---|---|---|---|
| 3% down | $12,000 | Down payment plus closing costs, which are commonly budgeted at 2% to 5% of the purchase price | Usually present | Higher because the loan balance is larger and PMI is often required |
| 10% down | $40,000 | Down payment plus closing costs | Usually present | Lower than 3% down, but PMI still affects the payment |
| 20% down | $80,000 | Down payment plus closing costs | Not needed once 20% equity is in place | Lowest of the three because PMI drops out |
The key question is not whether the bigger down payment looks cleaner on paper. It's whether you want to keep more liquid cash for repairs, moving, furniture, and the first round of surprises. That question matters even more if you're trying to save for the future at the same time. Buyers who are also thinking about long-term financial independence often need to compare the house decision with other cash goals, and planning early retirement with Velzee is a useful reminder that liquidity has value too.
I'd tell most first-time buyers to be suspicious of the reflex to chase 20% at all costs. If saving that much drains your reserves, the bigger down payment may create more stress, not less.
Running the Numbers in a Mortgage Calculator
A calculator is a planning tool, not a verdict. Used correctly, it helps you test scenarios quickly. Used lazily, it turns into a false sense of certainty.
Feed it the right inputs
Any decent mortgage calculator should ask for home price, down payment, loan term, interest rate, property taxes, homeowners insurance, HOA dues, and PMI when applicable. If those inputs are accurate, the result is useful. If they're guessed, the answer is mostly decoration.
When you run a real listing through a calculator, use the exact property details instead of neighborhood averages. Then compare the output against the two numbers that matter most, the lender-track number and your life-track number. If the calculator says you can afford it but your monthly surplus says otherwise, trust the surplus.
The three numbers that usually need manual checking are the ones many buyers gloss over:
- The actual property tax bill, pulled from the county record or current seller data.
- A real insurance quote, not a generic estimate.
- The exact HOA or association dues, including any special assessments if they exist.
That's the difference between a planning estimate and a closing-day surprise. It's also why online results can look friendlier than the first escrow reconciliation after closing.
You can use the same logic with a home loan repayment calculator as long as you treat the output as a draft, not the final word. Run the number, then pressure-test it with taxes, insurance, dues, and your own monthly budget. If the payment only works when every assumption is optimistic, it doesn't really work.
Putting It Together and Knowing When to Walk Away
The cleanest answer comes from combining both tracks. The lender-track number tells you what fits underwriting rules. The life-track number tells you what fits your household without choking your cash flow. The right purchase price is the one that survives both tests.
Walk away if the housing payment crowds out retirement savings, if closing costs wipe out your emergency reserves, or if your budget can't absorb a higher rate, higher tax bill, or a rough insurance renewal. Those aren't edge cases. They're the stress tests that separate a smart purchase from a tight one.
Pull your actual numbers, run the worksheet, and get a verified preapproval from a local lender. Then put those numbers in front of a Realtor who knows the western suburbs and knows which towns punish buyers on taxes, insurance, and HOA fees. That's how you buy with confidence instead of hope.
Homes By Carmen helps buyers in Melrose Park and the western suburbs turn confusing payment math into a clear plan. If you want help comparing lender approval with real monthly affordability, visit Homes By Carmen and start with a conversation that's grounded in your actual budget, not a generic calculator result.